What Database Latency Costs a Web Request
Database delay reaches a web request through its query path. When queries depend on earlier results, each round trip adds time to the request.
In a small Node.js endpoint, three sequential PostgreSQL queries turned 10 ms of extra round-trip time (RTT) into about 30 ms of median response time. The same pattern appeared across several web stacks. Full applications amplified the delay further.
P50 is the median request time. P95 is the 95th percentile.
These measurements came from local tests. They show how database delay can affect a request. They do not predict latency in every deployment.
Three waits become thirty milliseconds
The Node.js endpoint looked up a reader, loaded recent articles, then counted feedback for those articles. Each query used the result from the previous query.
At one client, median p50 rose from 1.47 ms at 0 ms RTT to 32.39 ms at 10 ms RTT. At eight concurrent clients, it rose from 1.24 ms to 31.53 ms. Each increase was close to the 30 ms that three sequential waits added.
The endpoint also handled far fewer requests per second at 10 ms RTT. Throughput fell from 671 to 31 requests per second at one client. It fell from 5,016 to 252 at eight clients. The benchmark recorded no failed requests across 57,000 measured requests.
- 0 ms RTT: p50 1.47 ms, p95 1.94 ms.
- 1 ms RTT: p50 4.69 ms, p95 5.04 ms.
- 2 ms RTT: p50 7.59 ms, p95 7.89 ms.
- 5 ms RTT: p50 16.85 ms, p95 18.03 ms.
- 10 ms RTT: p50 32.39 ms, p95 34.05 ms.
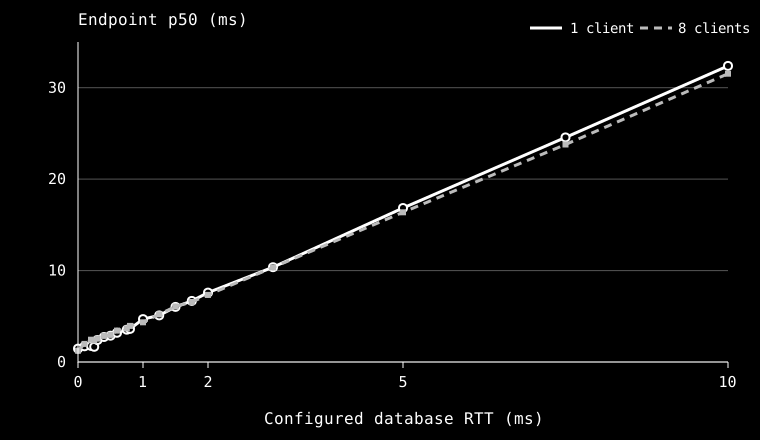
The count of sequential round trips matters more than the count of SQL statements. An application can overlap independent queries or combine them. Both changes can reduce the time added by network delay.
The stack changes the cost
A second test ran the same three-query route in Node.js, Go, Rust with Axum, and Ruby on Rails. Four configurations added about 31 ms between 0 and 10 ms RTT. A raw Axum route added about 63 ms because its driver prepared each query on every request. Reusing prepared statements brought it back near the other stacks.
The same test also compared a normal Rails route with a route that made one feedback query per article. The normal route made three sequential calls. The second made twelve. At 1 ms RTT, their p50 increases over zero RTT were 3.19 ms and 13.69 ms. At 10 ms RTT, they were 30.90 ms and 124.69 ms.
This is a query-pattern result. It is not a ranking of programming languages or frameworks.
Full applications amplify small delays
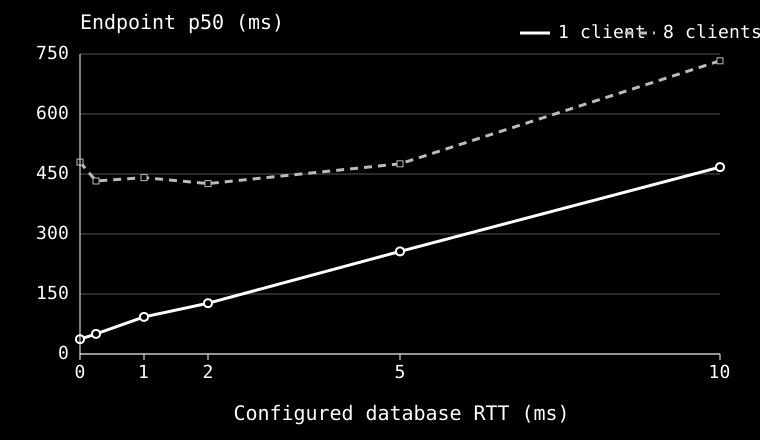
The tests also sent read requests to Redmine and Aimeos. At 10 ms configured RTT, Redmine p50 rose from 36.91 ms to 459.08 ms. Aimeos rose from 67.18 ms to 520.63 ms.
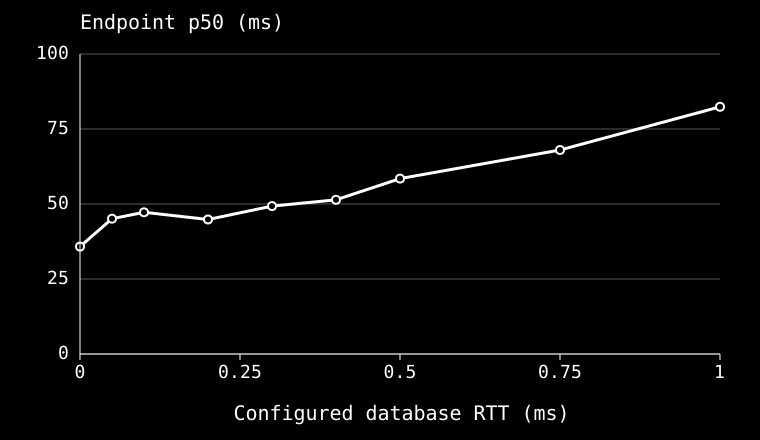
A later, denser test measured both applications below 1 ms RTT. At 0.75 ms, Redmine p50 increased by 32.23 ms. Aimeos increased by 34.37 ms. These results came from a separate test run. Do not combine them as one continuous sweep.
The app tests did not trace every network exchange. They show that full request paths can amplify small database delays. They do not identify an exact query count for each request.
What to measure
The practical unit is the request path. Trace the request, count database calls that must wait for earlier results, then measure the same request at the database RTTs you expect.
All tests ran in local containers on one DGX GB10 host. They used synthetic requests, small datasets, and controlled network delay. They did not test a cloud deployment or a managed database.
A separate compute placement paper tests how the best host changes as a Rails request makes more serial database calls. Its source and measurement data are available with the paper.