Sub-Millisecond Database RTT in Web Applications
At a configured 0.75 ms database round-trip time (RTT), four ordinary three-query routes gained 2.2 to 2.6 ms. A 12-query Rails route gained 9.6 ms. A Redmine API workload gained 32.2 ms, and an Aimeos storefront workload gained 34.4 ms.
The effect remained visible below 1 ms. Its size depended on the database work in each request. These tests ran in local containers on one DGX GB10 host. They did not use a cloud.
Framework routes
Each framework used the same feed route. It looked up a reader, selected articles, and counted feedback. Each query used the result from the previous query, so the route made three sequential database calls. The raw Axum route prepared each query on each request. The cached Axum route reused prepared statements.
- Go with
database/sqlandpgx: 0.91 ms at 0 ms, 3.40 ms at 0.75 ms. Change: +2.49 ms [2.29, 2.63]. - Node.js with
pg: 1.45 ms at 0 ms, 3.64 ms at 0.75 ms. Change: +2.19 ms [2.06, 2.52]. - Rails with Active Record: 1.90 ms at 0 ms, 4.16 ms at 0.75 ms. Change: +2.26 ms [1.97, 2.47].
- Axum with cached statements: 0.83 ms at 0 ms, 3.40 ms at 0.75 ms. Change: +2.57 ms [2.22, 2.70].
- Axum with raw query strings: 1.21 ms at 0 ms, 6.32 ms at 0.75 ms. Change: +5.11 ms [4.82, 5.48].
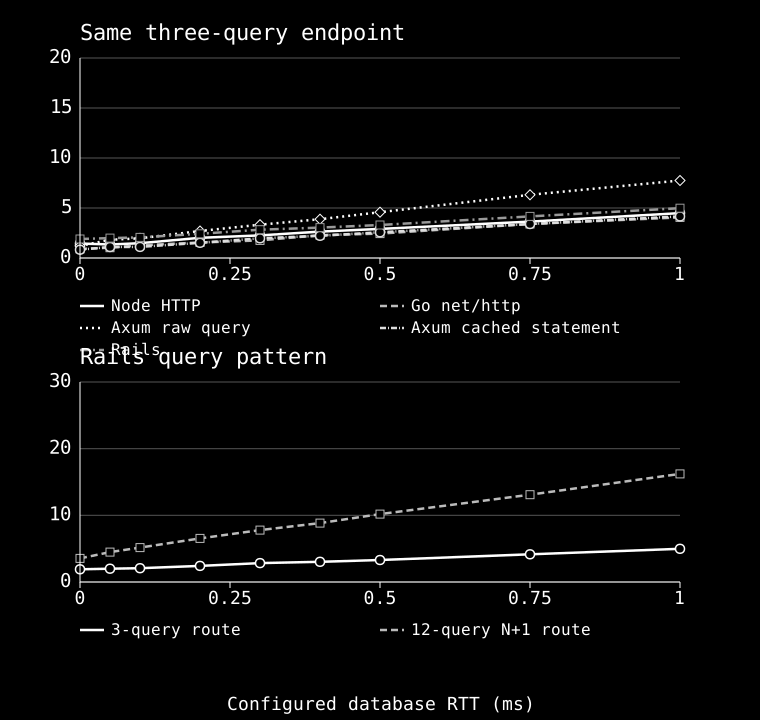
The three-query routes gained about the 2.25 ms predicted by three sequential waits at 0.75 ms each. The raw Axum route gained more because it also prepared statements. The cached route stayed near the other three-query routes. This compares complete runtime and driver stacks. It does not isolate language speed.
The normal Rails route used three calls. A second route used one feedback count for each of ten articles. It made 12 sequential calls in total.
- Grouped feedback counts, 3 calls: 1.90 ms at 0 ms, 4.16 ms at 0.75 ms. Change: +2.26 ms [1.97, 2.47].
- One feedback count per article, 12 calls: 3.54 ms at 0 ms, 13.09 ms at 0.75 ms. Change: +9.55 ms [9.26, 10.40].
The 12-call route gained close to the 9 ms predicted by 12 sequential waits at 0.75 ms each. This is a query-pattern result. It is not a framework ranking.
Open-source applications
The Redmine workload sent authenticated reads to the Redmine 6.1.4 REST API. Its mix used 60% paginated issue lists, 30% issue details with journals, and 10% project lists. The test seeded 12 projects and 360 issues.
The Aimeos workload used a Laravel storefront and its demo catalog. It sent 60% product searches and 40% product detail requests. The catalog contained 17 products.
Redmine 6.1.4 ran with Rails 7.2.3.2. Aimeos used Laravel 13.33.0 and PHP 8.4. Both apps used PostgreSQL 18.6.
- 0 ms: Redmine 35.78 ms. Aimeos 65.74 ms.
- 0.05 ms: Redmine 45.11 ms, change +9.33 ms [8.10, 10.56]. Aimeos 64.47 ms, change -1.27 ms [-4.64, 1.85].
- 0.1 ms: Redmine 47.22 ms, change +11.43 ms [10.71, 12.63]. Aimeos 71.23 ms, change +5.48 ms [1.88, 7.17].
- 0.2 ms: Redmine 44.82 ms, change +9.03 ms [7.27, 10.60]. Aimeos 76.08 ms, change +10.33 ms [7.97, 11.80].
- 0.5 ms: Redmine 58.45 ms, change +22.67 ms [19.75, 23.84]. Aimeos 89.26 ms, change +23.51 ms [21.21, 25.29].
- 0.75 ms: Redmine 68.02 ms, change +32.23 ms [30.39, 34.80]. Aimeos 100.12 ms, change +34.37 ms [30.71, 35.80].
- 1 ms: Redmine 82.42 ms, change +46.63 ms [44.15, 51.09]. Aimeos 111.55 ms, change +45.80 ms [43.03, 48.55].
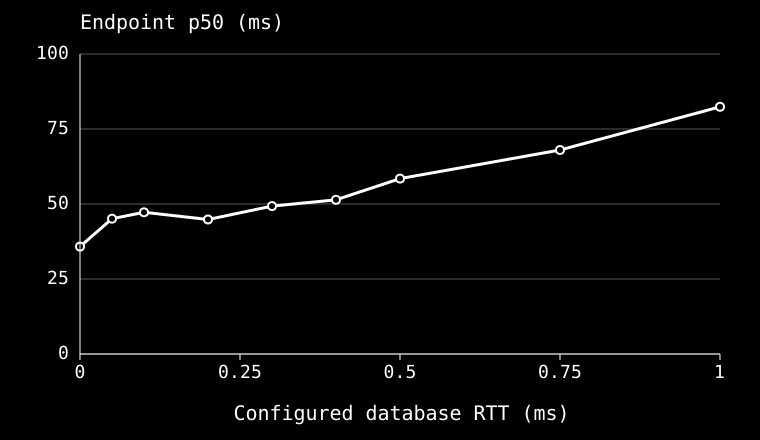
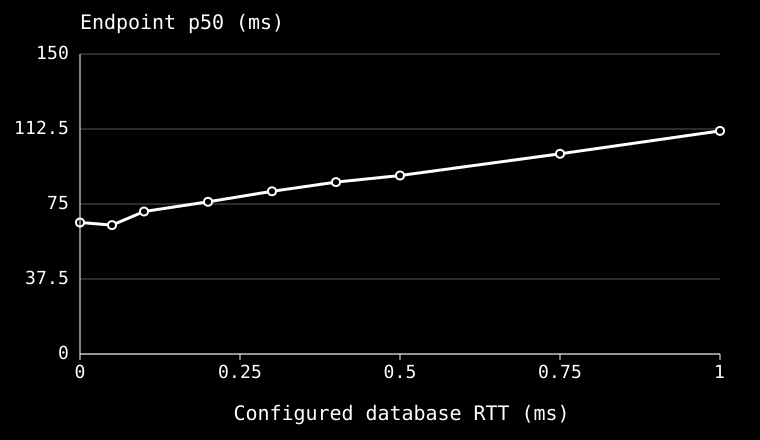
At 0.75 ms, the Redmine median increased by 90%. The Aimeos median increased by 52%. Each app showed about 32 to 34 ms of added request time from less than one millisecond of configured RTT. The ratio of the request increase to configured RTT was about 43 for Redmine and 46 for Aimeos. These ratios describe this workload and test setup. They are not database query counts.
The smallest Redmine settings did not follow a smooth progression. The 0.05 and 0.1 ms settings
added more request time than a one-event-per-round-trip model predicts. At 0.05 ms, an uncached
SELECT 1 call gained 0.077 ms at the median. Forty-one such waits would add about 3.2 ms, while
the Redmine request median gained 9.3 ms. At 0.1 ms, the same model predicts 4.6 ms, while the
request median gained 11.4 ms. The trace does not explain these differences.
Redmine SQL trace
A separate trace counted uncached Active Record SQL notification events for 100 requests. It did not run with the timing measurements. The trace saw 41 events per issue-list request at the median, 20 per issue-detail request, and 8 per project-list request.
- Issue list: 60 requests, 41 events per request at the median, range 41 to 68.
- Issue detail: 30 requests, 20 events at the median, range 20 to 30.
- Project list: 10 requests, 8 events at the median, range 8 to 10.
The issue-list count is close to the measured amplification ratio. An SQL event count does not show whether each event caused a separate network round trip. A protocol trace would be needed to make that claim.
Measurement method
The app, database, and probe ran in separate Docker containers on the local DGX GB10 host. The test
used one client. Linux tc netem added half of each target delay to the app container and half to
the database container. The tested settings were 0, 0.05, 0.1, 0.2, 0.3, 0.4, 0.5, 0.75, and 1 ms.
The task order was shuffled.
Each framework condition ran 20 times with 100 measured requests and 20 warmup requests per run. Redmine used the same run and request counts. Aimeos ran 10 times with 50 measured requests and 20 warmup requests per condition. No measured requests failed.
Each run produced a p50. The reported p50 is the median across run-level p50 values. The 95% CIs use 10,000 bootstrap samples of run-level p50 values. The CIs for changes resampled the baseline and target runs independently, then subtracted their medians.
A separate network check sent 50 ICMP packets between two local containers at each setting. The
check used the same netem queue, including at 0 ms. It measured a mean RTT of 0.063 ms with no
injected delay, 0.806 ms at a configured 0.75 ms, and 1.008 ms at a configured 1 ms. This checks
the container network path. It does not measure a PostgreSQL query.
A second probe ran 200 uncached SELECT 1 calls through the Redmine Rails adapter in each of five
runs per setting. At configured RTTs of 0.75 and 1 ms, median query times increased by 0.756 ms
[0.736, 1.007] and 1.007 ms [0.988, 1.503]. This probe includes the Rails adapter and local host
scheduling. Its medians varied at some lower settings.
Limits and next question
These were synthetic requests to real applications. They were not captured production traffic. The tests used one local host and one client. They do not measure cloud placement or predict latency for a managed database. The Redmine trace counted SQL notification events, not network exchanges. The smallest RTT settings need more investigation because the request deltas did not always match the standalone query probe.
The results motivate a follow-up systems question. Can a platform identify handlers that wait for many database results in sequence, then place only those handlers near the database primary? This experiment does not test such a scheduler.