Database Latency Follows the Request Path
At 1 ms of configured database round-trip time (RTT), a three-query endpoint added 3.1 to 6.8 ms across five web stacks. Read requests against Redmine and Aimeos added 42.8 and 46.3 ms. At 10 ms, the two applications added 422 and 453 ms. The request path amplified the network delay. The effect depended on the database driver and the work that each request performed.
A shared three-query route
The framework comparison returned the same feed from PostgreSQL in Node.js, Go, Rust with Axum, and Ruby on Rails. Each request looked up a reader, selected articles, and counted feedback. Each query used the result of the prior query. This made the three database round trips sequential.
The table reports the median of three per-run p50 values. Each run measured 60 requests at one client after 10 warmup requests.
| Stack, p50 ms | RTT 0 | RTT 1 | RTT 2 | RTT 10 |
|---|---|---|---|---|
Node.js with pg | 0.77 | 4.56 | 7.54 | 32.35 |
Go with database/sql and pgx | 0.79 | 3.90 | 7.24 | 31.97 |
| Axum with raw query strings | 0.49 | 7.25 | 13.82 | 63.49 |
| Axum with cached statements | 0.48 | 4.18 | 6.70 | 31.83 |
| Rails with Active Record | 1.85 | 5.04 | 7.72 | 32.75 |
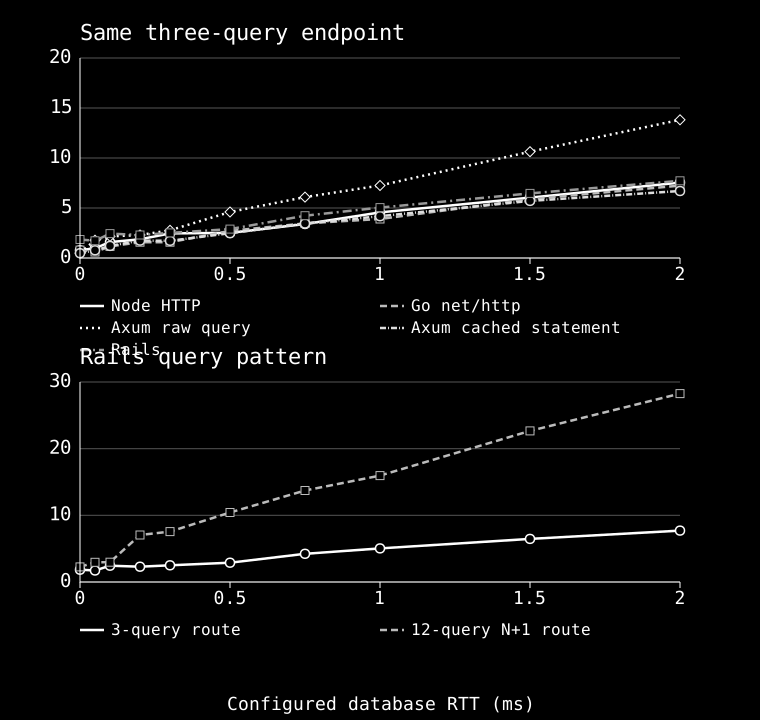
Four configurations added about 31 ms between 0 and 10 ms RTT. This matches the 30 ms delay from
three sequential round trips. The raw Axum route added 63 ms. tokio-postgres prepares a raw query
before it executes it. The cached Axum route reused prepared statements and returned to the range of
the other stacks. The tokio-postgres query source describes this behavior.
The deadpool-postgres statement cache describes statement reuse.
This measures complete runtime, framework, and database-driver stacks. It does not isolate language performance.
Query count changes the slope
The normal Rails route used three sequential queries. A second route counted feedback with one query per article. It made 12 sequential queries in total.
| Route, p50 ms | Queries | RTT 0 | RTT 1 | RTT 2 | RTT 10 |
|---|---|---|---|---|---|
| Grouped feedback counts | 3 | 1.85 | 5.04 | 7.72 | 32.75 |
| One feedback count per article | 12 | 2.27 | 15.96 | 28.25 | 126.96 |
At 1 ms RTT, the 12-query route added 13.7 ms over zero RTT. At 10 ms RTT, it added 124.7 ms. The extra nine round trips account for most of the increase. This is a query-pattern example, not a framework ranking.
Full application request paths
The Redmine workload used the official Redmine 6.1.4 image with Rails 7.2.3.2 and PostgreSQL 18.6. It loaded Redmine's default data, then created 12 projects, 360 issues, and journal entries with Redmine's Rails models. The probe sent authenticated GET requests to the REST API. The fixed mix used 60% paginated issue lists, 30% issue details with journals, and 10% project lists. The Redmine issue API supports these read requests.
The Aimeos workload used the Aimeos Laravel storefront, Laravel 13.33.0, PHP 8.4, PostgreSQL 18.6, and Aimeos's demo catalog. It sent 60% search-list requests and 40% product-detail requests to products found in the live catalog. The demo catalog contained 17 products.
| Configured RTT | Redmine p50 ms | Aimeos p50 ms |
|---|---|---|
| 0 ms | 36.91 | 67.18 |
| 0.5 ms | 58.98 | 90.57 |
| 1 ms | 79.68 | 113.51 |
| 2 ms | 126.39 | 153.93 |
| 10 ms | 459.08 | 520.63 |
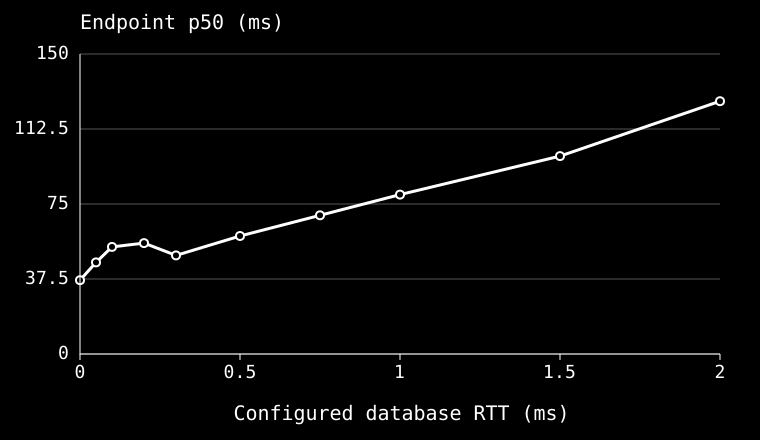
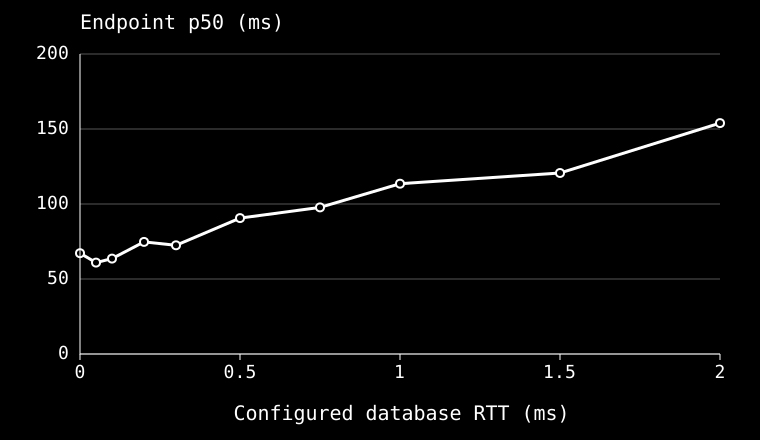
The dense follow-up used 20 measured requests per condition for Redmine and 10 for Aimeos. Each condition ran three times at one client. At 10 ms RTT, the three Aimeos run-level p50 values ranged from 507 to 1,081 ms. The median was 521 ms. This spread shows that three repetitions do not remove all host noise.
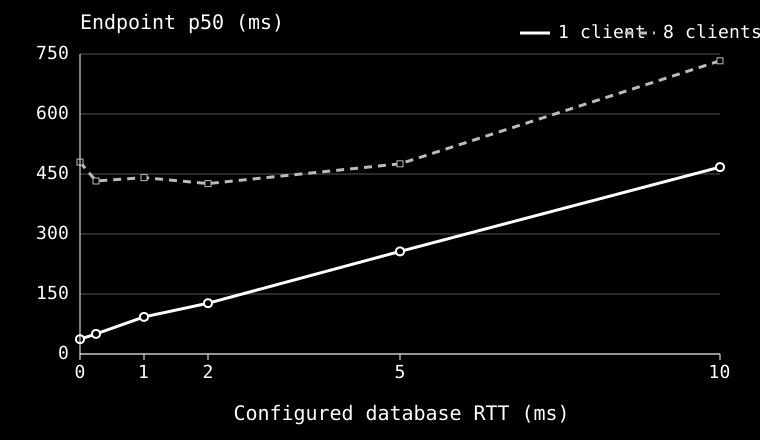
The original Redmine sweep also tested eight clients. Its median p50 ranged from 480 ms at 0 ms RTT to 733 ms at 10 ms RTT. At 0 to 5 ms, the results varied and did not show a clear latency slope. These measurements do not identify a single cause for that pattern.
Measurement method
All tests ran on one local DGX GB10 host. Docker Compose ran each application and PostgreSQL in
separate containers. PostgreSQL used version 18.6. The dense sweep tested 0, 0.05, 0.1, 0.2, 0.3,
0.5, 0.75, 1, 1.5, 2, 5, and 10 ms of configured RTT. Linux tc netem added half of each delay to
the app container's outbound interface and half to the database container's outbound interface.
The 0 ms condition added no network delay.
The stack sweep used three repetitions for each condition. It covered five stack configurations and the 12-query Rails route, with 10 warmup requests per run. It measured 11,880 requests across 216 runs. The Redmine dense sweep measured 720 requests across 36 runs. The Aimeos sweep measured 360 requests across 36 runs. No measured request failed in these three sweeps. Each table reports the median of the run-level p50 values.
The Aimeos app used eight PHP CLI server workers to prevent its test server from queueing concurrent requests behind one process. The experiment used one client. PHP documents this multiworker mode for testing, not production use. See the PHP CLI server documentation.
Limits
These are synthetic requests to real applications. They are not captured production traffic. The dense sweeps used one client, three repetitions, and small request counts. The tests ran in local containers. They do not estimate latency between cloud compute and a managed database. The app traces did not count sequential SQL round trips, so the full-application results show amplification but do not identify an exact query count.
The Zulip Django container did not pass initialization because Memcached SASL authentication failed. It produced no valid request results, so this paper reports no Zulip measurement.
The evidence supports a narrow conclusion: database RTT can add several times its nominal value to an application request when the request waits for sequential database work. Measure the request path, driver, and deployment that you plan to use.