What 10 ms of Database Latency Costs a Web Request
Adding 10 ms of database round-trip time increased median response time by about 30 ms in a Node.js and PostgreSQL web endpoint. The endpoint made three dependent database calls. Each call added about one round trip to the request path.
This result gives a practical rule for this workload: count the sequential database exchanges on the request path. A 10 ms database round trip can cost about 30 ms when the application must wait for three results in order.
The request
I built a small Node.js HTTP service with PostgreSQL. Its /feed endpoint runs three sequential queries. It finds a reader, gets that reader's latest articles, then counts feedback for those articles. Each query uses the result from the prior query.
The database held 100 readers, 1,000 articles, and 100,000 feedback records. The service used Node.js 22.23.3 and the pg 8.16.3 driver. PostgreSQL ran version 18.6.
The app and database ran in separate Docker containers on the DGX GB10. The Linux host ran kernel 6.17.0 and Docker 29.2.1. The benchmark client sent HTTP requests to the app over loopback. Linux netem added half of each target delay to both container egress paths. The resulting configured round-trip times ranged from 0 to 10 ms.
The sweep used 19 settings. It sampled more closely below 2 ms, where the effect of one round trip is small. Each setting ran five times in shuffled order. Each run warmed the app with 60 requests, then measured 200 requests at one client or 400 requests at eight concurrent clients.
P50 is the median request time. P95 is the request time at the 95th percentile. I report the median p50 and p95 across the five runs.
The chart shows median endpoint p50 latency across the five runs. Both load levels followed the same pattern.
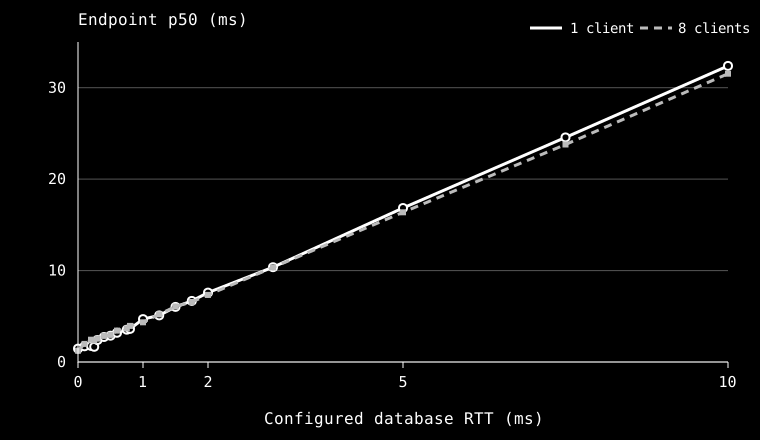
At one client, median p50 rose from 1.47 ms at 0 ms RTT to 32.39 ms at 10 ms RTT. At eight concurrent clients, it rose from 1.24 ms to 31.53 ms. The increase was 30.92 ms and 30.29 ms, close to the 30 ms added by three sequential round trips.
| Database RTT | p50, one client | p95, one client |
|---|---|---|
| 0 ms | 1.47 ms | 1.94 ms |
| 1 ms | 4.69 ms | 5.04 ms |
| 2 ms | 7.59 ms | 7.89 ms |
| 5 ms | 16.85 ms | 18.03 ms |
| 10 ms | 32.39 ms | 34.05 ms |
Throughput fell as well. At one client, the service handled 671 requests per second at 0 ms RTT and 31 at 10 ms. At eight concurrent clients, it handled 5,016 and 252 requests per second. The benchmark reported no failed requests across 57,000 measured requests.
The smallest delay points were noisy. At 0.1 ms RTT, one-client p50 ranged from 1.07 to 2.09 ms across the five runs. That 1.02 ms spread is larger than the 0.3 ms increase expected from three serial round trips. The effect was clearer at 1 ms and above.
What this result means
The added time follows the number of dependent round trips. It does not follow the number of SQL statements alone. An app can overlap independent queries or combine them. Those choices can reduce the time that network delay adds to the request.
This experiment used one endpoint, one seeded database, and containers on one host. It did not test Rails, Django, Laravel, or a production network. The fine-grain results below 1 ms also varied more than the results at higher RTT. Treat the measured values as a controlled example, not as a forecast for every web app.
The practical check is simple: trace a slow request, count the database round trips that depend on each other, then compare that count with the app's measured response time.